
This weekend I took part in the NHS Hack Day. The idea of the event is to bring healthcare professionals together with technology enthusiasts in order to build stuff that is useful for those within the NHS and for those that use it. It was organised by AnneMarie Cunningham, who did a great job in making the whole thing run smoothly!
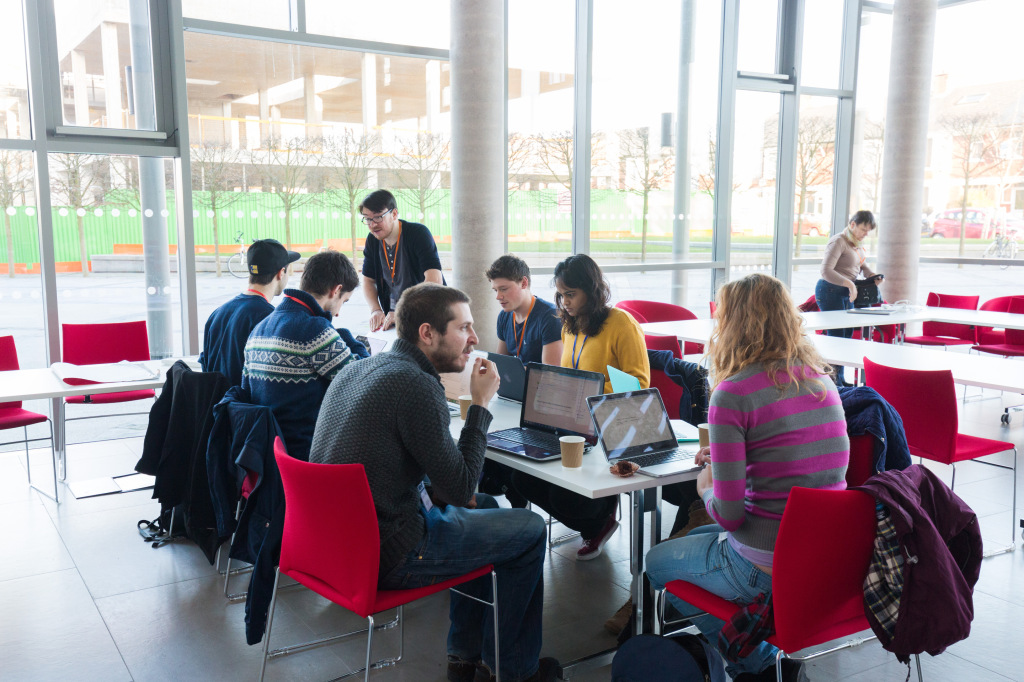
This was our team! The image is released under a Creative Commons BY-NC2.0 license by Paul Clarke.
I was asked to go along and give a hand by Martin, who also had four of his MSc students with him. Matt, previously from Cardiff CS&I, also came to provide his data-handling expertise.
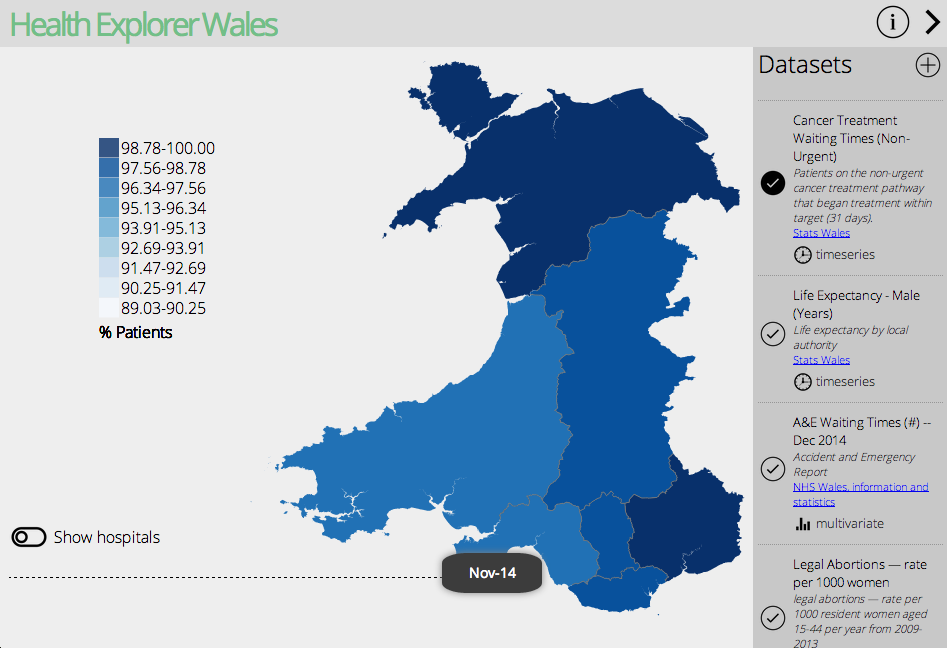
We built a webapp, called Health Explorer Wales, that attempts to visualise various data for health boards and communities in Wales. One of the main goals of the app was to make it maintainable, so that users in future could easily add their own geographic or numeric data to visualise. For this, it was important to decide on an extensible data schema for describing data, and suitable data formats.
Once the schema was finalised, we were able to go ahead and build the front-end, which used D3.js to handle the visualisations. This was the only third-party library we used in the end. The rest of the interface included controls, such as a dataset-selector and controls for sliding back through time (for timeseries data). The app is purely front-end, which means it can essentially be shipped as a single HTML file (with linked scripts and styles).
We also included an ‘add dataset’ feature, which allows users to add a dataset to be visualised, as long as the schema is observed. In true hackathon style, any exceptions thrown will currently cause the process to fail silently ;) The GitHub repository for the app contains a wiki with some guidance on data-formatting. Since the app is front-end only, any data added is persisted using HTML5 local storage and is therefore user-specific.
Generally, I am pleased with the result. The proof-of-concept is (mostly) mobile-friendly, and allows for easily showing off data in a more comprehensible way than through just using spreadsheets. Although we focussed on visualising only two datatypes initially (we all <3 #maps), we hope to extend this by dropping in modules for supporting new formats in the future.
There were many successful projects completed as part of the event, including a new ’eye-test’ concept involving a zombie game using an Oculus Rift and an app for organising group coastal walks around Wales. A full list of projects is available on the event’s website. I really enjoyed the weekend and hope to make the next one in London in May!